Introduction
Simulation Engineering Technologies, or SET, specialises in developing computer simulation models that can evaluate the production potential of a block cave mine. Block cave mining is a complex system, therefore, the approach often followed is to model parts or sections of the block cave mine system separately. These sub-systems can include undercut and extraction level, infrastructure layout, draw control and strategy, ore handling systems, underground fleet systems, etc.
In order to determine the potential production capability of the mine, the following modelling techniques are applied to different aspect within each of the sub-systems such as production scheduling, production throughput, availability of drawpoints, fragmentation, and secondary breakings. The challenge exists when the system has to be modelled in its entirety, as each of these systems are interdependent. Traditional modelling tools fall short in accurately capturing this complexity and thus results in limited insights gained from the model which can be used in decision-making.
PROBLEM
Traditional modelling approaches are highly dependent on expert and developer involvement. With the ever-increasing complexity of mining, a more comprehensive approach is needed to accurately represent the system and draw useful insights. Variability is captured in these traditional modelling approaches through distributions, thereby allowing the model to mimic process behaviour.
However, a real-world system is affected by many factors such as availabilities, varying utilisations, presence of buffers, etc. Additionally, processes within the system could have control philosophies that change during mine operations.
LHD operations were considered as an example in demonstrating the practical discrepancies and uncaptured critical operations by traditional models. The following key operations proved hard to capture:
- Waiting time of the truck or LHD to dump due to congestion
- Waiting time due to equipment blockages (e.g. blocked grizzly)
- Waiting time to dump due to hang-ups
- Waiting for ore because no draw points are available for loading
- Relocation travel time
These uncaptured events when moving from one process to another result in large discrepancies in mine production.
SET utilises a data-driven modelling approach whereby real-time data are used as input to the model to derive exact process or system results. Traditional modelling approaches are decoupled from real-time data as assumptions and historical data are used. Simio® can incorporate data from different data sources such as Excel® files as well as live databases and MES. This allows SET to construct dynamic simulation solutions by binding models to real-time data sources.
CASE STUDY
SET completed a project to design a dynamic simulation solution for a block cave mine that is accurate, flexible, and user-friendly. The model had to be capable of capturing the complexities of the operations across multiple caves, including the unique operational control philosophies of each cave and process operations. The simulation included operations from undercut and extraction levels to underground logistics and ore handling systems. In analysing the ore handling system, the main objective of the project was to test the probability of future improvements to achieve a production target, given the current and projected drawpoints production ratios.
The model was developed using Simio® simulation software, and it was used to evaluate and capture changes in ore handling productivity. This simulation tool has the capability to capture complex details from ore handling and process equipment capacities, the number of available drawpoints, on-scale drawpoints layout, ore fragmentation, and mine operating procedures to name a few.
Using Simio®, specific customised objects were used to represent the following areas of interaction:
- Drawpoints mining activity, hang-ups, and maintenance
- Traffic intersections
- Production drift traffic control, the prioritisation, tipping control, as well as the equipment allocation
- Travel and movement links – captured using movement parameters and utilisation of travelling vehicles
Once the detailed simulation model was completed and an on-scale layout was successfully created, the unique process logic of the mine operations was developed to accurately represent the current-system and proposed future improvement scenarios.
APPROACH
A detailed and flexible simulation model was developed using a data-driven approach. This approach incorporated current and future mine plan data and drawpoints coordinates that were transformed into a digitised, numerical mapping of the current and future mine layouts. LHD and truck movements along panel drifts together with loading, dumping, queueing, and waiting time variances were captured in this model. Additionally, dynamic legends were added to indicate the status of drawpoints, displaying availability (dry or wet), and hang-ups states (low, medium, or high hang-up incurred).
CONCLUSION
The objective of the case study was to identify potential bottlenecks in the existing system that are limiting production and to test viable mitigation strategies to alleviate those bottlenecks and quantify the potential achievable benefits.
An analysis of the base case system indicated that the main bottleneck of the system lies in the material handling systems. This bottleneck resulted in production shortfall, the ineffective use of equipment, and lost time.
By testing the various modelling scenarios, it was determined that the production shortfall was mainly due to congestion at the crusher which in turn increases tipping congestion and prolongs the overall haulage cycle times. The proposed solution was developed through running different scenario where the crusher and buffer bin were centralised.
The proposed solution allows an even distribution draw, reduces the cycle times by 3.5 % and increases daily production tonnage by approximately 500tpd on average. Furthermore, the average time spent waiting to tip which accounted for 5.0 % of the effective shift time, is reduced to 1.1%.
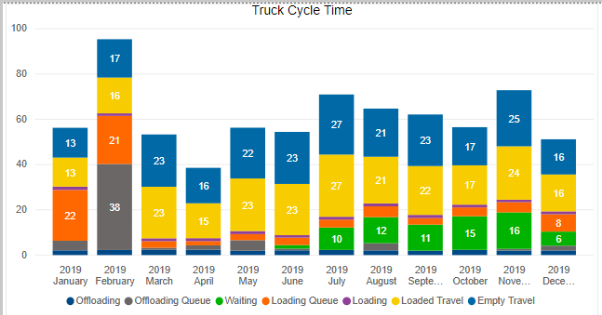
Figure 1: Truck Cycle Time Breakdown
Figure 1 provides a utilisation breakdown of the truck cycle which helps identify the root cause of problems. Unlike traditional modelling where cycle time is calculated based on start and end time, the new modelling technology allows the SET team to capture subsequent states within the cycle time which can be further broken down into detailed activities.
For example in Figure 1, waiting state is broken down into smaller contributing activities such as waiting to tip due to hang up clearance, congestion at a tipping area, waiting for other equipment or vehicle to finish tipping.
In conclusion, using new simulation technology, SET was able to accurately model the operations of a block cave mine and identify trends which suggest that because of the material handling system constraints increased traffic at available the tipping area results in excessive equipment waiting time.
Cover image via: International Mining