Abstract
Mine development and tunnelling require significant investment. Optimised resource planning and scheduling of underground mine development can prove to be extremely valuable by ensuring your development project is completed on time and within budget. This paper will showcase innovative work where mine design data were directly integrated with specialised mine development simulation software to rapidly develop a detailed, on-scale model of an underground Long Hole Open Stope mine’s access development tunnels. The direct integration of the mine design as well as various rock and face attributes enabled accurate model configuration, testing of various development mining operations and powerful scenario analysis. This approach decreased model setup time and limited data transfer – and setup related errors. The simulation model was utilised to evaluate a variety of technology trade-offs being considered. These technology considerations involved:
- Manual versus automated.
- Cutting versus drilling.
- Various blasting operations.
In the design there are four access tunnels from the portals into the mining operation for ventilation and logistical purposes. The mine design and attributes are imported into the simulation software to create a “dynamic mine design”. The model parameters that are configured can in turn be applied to the actual design, including development cycles used to develop the various tunnels, equipment parameters and times for each face size (e.g. drilling times, LHD capacity, speeds, etc.), tipping destinations, shift schedules and equipment maintenance. Various development scenarios were designed to determine which mining- and technology options would be most effective to access the Long Hole Open Stope orebody earlier during the life of the operation, in order to improve the Net Present Value of the project. Evaluating the model outputs and scenario experimentation were used to determine the following:
- The achievable development rates based on the development activity cycles (e.g. drilling, blasting, cleaning and supporting cycles of the conventional, and civil tunnelling methodologies).
- Equipment capabilities and fleet requirements to achieve and sustain the required development rates.
- Gross and net development cycle times.
- Utilisations and productivity of mining development equipment.
- Maximum possible capital access meters based on planned trackless forecast.
- Impact of various mining technology options as well as Tunnel Boring Machines (TBM) trade-offs.
The capability to integrate mine design layouts directly into simulation software enabled the client to evaluate conventional access options and various rapid development technologies to best access the orebody in the shortest timeframe and at the lowest possible cost. Therefore, the approach followed, improved the NPV of the client’s project by providing a plan for accessing the orebody earlier in the life of the operation.
1. Introduction
Mine development and tunnelling require significant investment. Optimised resource planning and scheduling of underground mine development can prove to be extremely valuable by ensuring the development project is completed on time and within budget. The paper will focus on an innovative way to quickly and accurately determine development- and production rates through the integration of mine design data with specialised simulation software as appose to the traditional project scheduling approached of spreadsheet-based solutions.
The objective of the study was to compare various access development options and technology trade-offs for developing the underground infrastructure from the mine portals to the start of the production development sections.
Various development scenarios were designed and tested to determine which mining- and technology options would be most effective to access the Long Hole Open Stope orebody earlier during the life of the operation. By establishing the best mining- and technology option configuration, the Net Present Value of the project could be significantly improved. The scenario experimentation results were analysed to determine the achievable development rates based on the development activity cycles, equipment capabilities and fleet requirements to achieve and sustain the required development rates, utilisation of mining development equipment, maximum possible capital access meters based on planned trackless forecast, and the impact that various mining technology options may have on development rates.
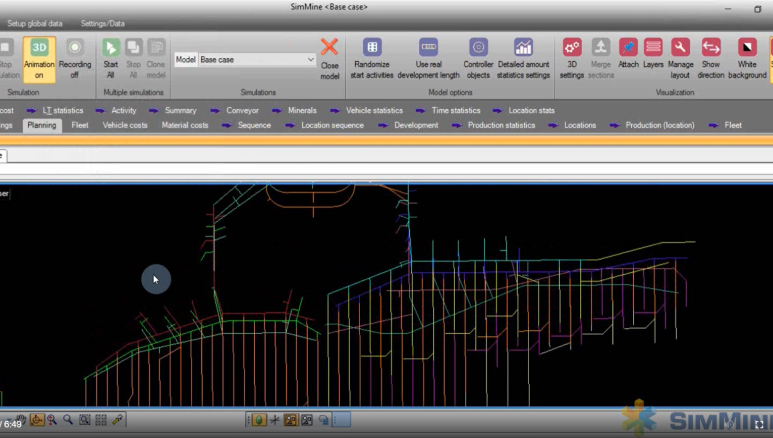
There are four access tunnels from the portals into the mining operation, which will be utilised for accessing the mine, as well as for ventilation and logistics purposes. Figure 1 illustrates the mine design imported from Deswick file format, showcasing the four access tunnels.
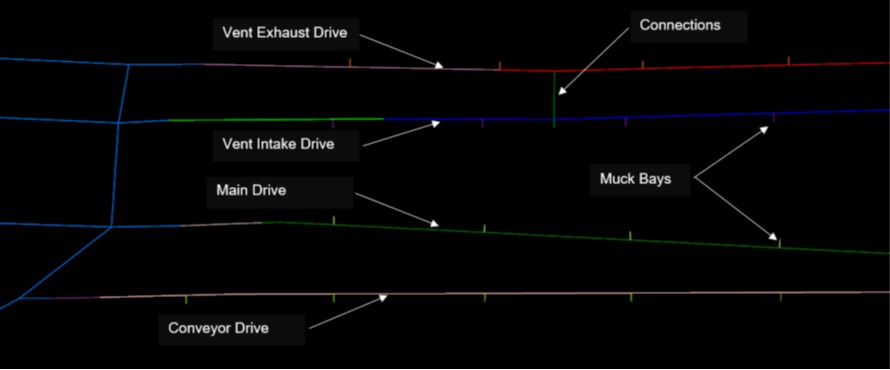
Figure 1: Schematic depicting the simulated access tunnels
When evaluating complex systems, dynamic simulation is the preferred method, because unlike spreadsheet or deterministic models, it has the capability of capturing the dynamic behavior that is present in a real-world system. Simulation models consider competition for resources, queuing, traffic, variability in process times, random breakdowns and events, and changing operating conditions over time. This variability allows for a realistic assessment of the type of development and production performance that can be expected. “What-if” experimentation can be carried out allowing different configurations and operating strategies to be analysed before the actual operation commence.
2. Methodology
The simulation model was developed by making use of the latest SimMine® simulation software. The information required for the trackless mining equipment and ore handling systems were sourced from the project team. The Deswick mine design, along with various rock and face attributes such as rock densities, face height and width were imported into SimMine® for each development section including each individual tunnel and its respective connections. This assisted to decrease model setup time and limit the number of data transfer errors.
2. 1 Model Construction
The basic simulation model construction and setup steps are:
- Import design layout centrelines from Deswick.
- Import rock – and face size attribute properties from Deswick.
- Set up the main-, conveyor access, ventilation intake, and exhaust drive tunnels.
- Set up development cycle(s) to be used by various drives.
- Set up muck bays with relevant spacing and capacities.
- Define equipment and performance parameters with times and variation for each face size (e.g. drilling times, LHD capacity, speeds, etc.).
- Define each crew’s tunnel work location.
- Set up tipping destinations for LHDs (muck bays) and trucks (tip outside portal).
- Set up equipment maintenance and availability parameters (services, MTBF, MTTR etc.).
- Set up shift schedules.
3. Scenarios
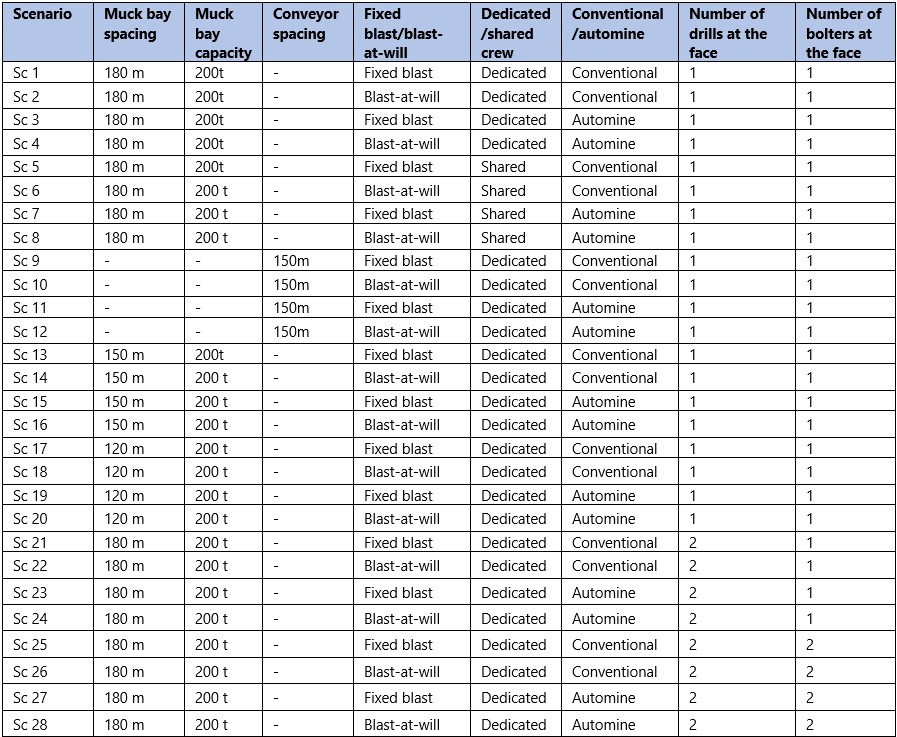
All Drill and Blast scenarios evaluated are described in Table 1. The table reflects numerous variations tested for muck bay spacing, blasting schedules, crew sharing and number of equipment in a crew, as well as conventional versus automine shift schedules and equipment parameters. These scenarios were preselected by the client to distinguish any possible advantage a scenario achieves compared to another. The designed access tunnels are more than 5km in length, thus any small advantage could have a significant impact over the development duration.
All scenarios tested are feasible in reality; due to the large face excavations required by the mine design, it is possible that more than one piece of equipment could be used at the face for the drilling or bolting activity. Although more equipment at the same face will in practice require additional management strategies, which were not taken into account in this study.
Table 1 – Summarised drill and blast scenario descriptions
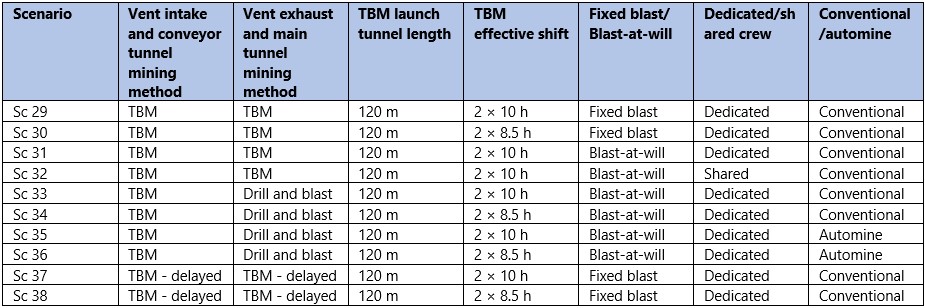
Tunnel Boring Machine (TBM) scenarios evaluated are described in Table 2 and numbered as scenarios 29 to 32. All four drives are cut by dedicated TBMs. The assumption was made that a 12-month manufacturing time and 2-month shipping time will be required before the tunnel start date to allow the TBMs to be available for setup once the 120 m launch tunnel has been drill and blasted.
In scenarios 33 to 36 the vent intake and conveyor drives are cut with TBM’s, with the vent exhaust and main access drives developed via Drill and Blast connecting into the TBM tunnel every 500m. The Drill and Blast LHD’s first tip at the nearest muck bay. Thereafter, a second LHD uses the connections to tip from the muck bay onto the TBM trailing conveyor. The blasting schedules, crew sharing, as well as conventional versus automine shift schedules and equipment parameters in the table were only applied to the initial 120 m launch tunnels developed by Drill and Blast.
Scenarios 37 and 38 are similar to scenarios 29 and 30, but with the assumption that the 12-month manufacturing time and 2-month shipping time of a TBM occurs only after the 120m launch tunnels start with Drill and Blast development.
Table 2 – Summarised TBM scenario descriptions
4. Results
This section documents the results obtained from the model for the Access Development Simulation. Due to the large number of scenarios tested during the study, only key comparative results are shown and discussed. The model was validated by comparing inputs to the resulting outputs for specific mining tasks (e.g. drilling-, bolting- , loading times, etc.), as well as studying the interaction between equipment in the model to ensure the behaviour mimics activities found in underground mining.
Table 3 depicts the simulated duration of each tunnel drive for all Drill and Blast scenarios evaluated (scenarios 1 to 28). The tables are colour coordinated to represent various levels of performance established in the study. Green is indicative of achieving the minimum study requirement for Drill and Blast, based on the average advance per month depicted as a percentage difference compared to the Base Case (scenario 1) reflected in Table 4. All scenarios have the same start date, including the TBM scenarios that succeed the Drill and Blast section.
It should be noted that not all tunnels perform the same within each scenario and do not have the same increase in advance between the scenarios. This is due to the various face sizes of each tunnel resulting in differing equipment activity times required for the development crews. The development cycle for each tunnel and how it fits into the applied shift schedule results in additional blasts achieved and increased monthly advance. This is a unique outcome that can only be captured by integrating the mine design to the simulation model. Similarly, without the simulation study there would have been no way of determining the impact of the hybrid TBM & Drill and Blast scenarios and the effect the different mining methods have on one another as well as on the development of each tunnel’s advance.
Figure 2 illustrates an example progressive animation, based on the Deswick mine design, where TBMs develop the four tunnel drives from the portal to the end where the mining operation starts.
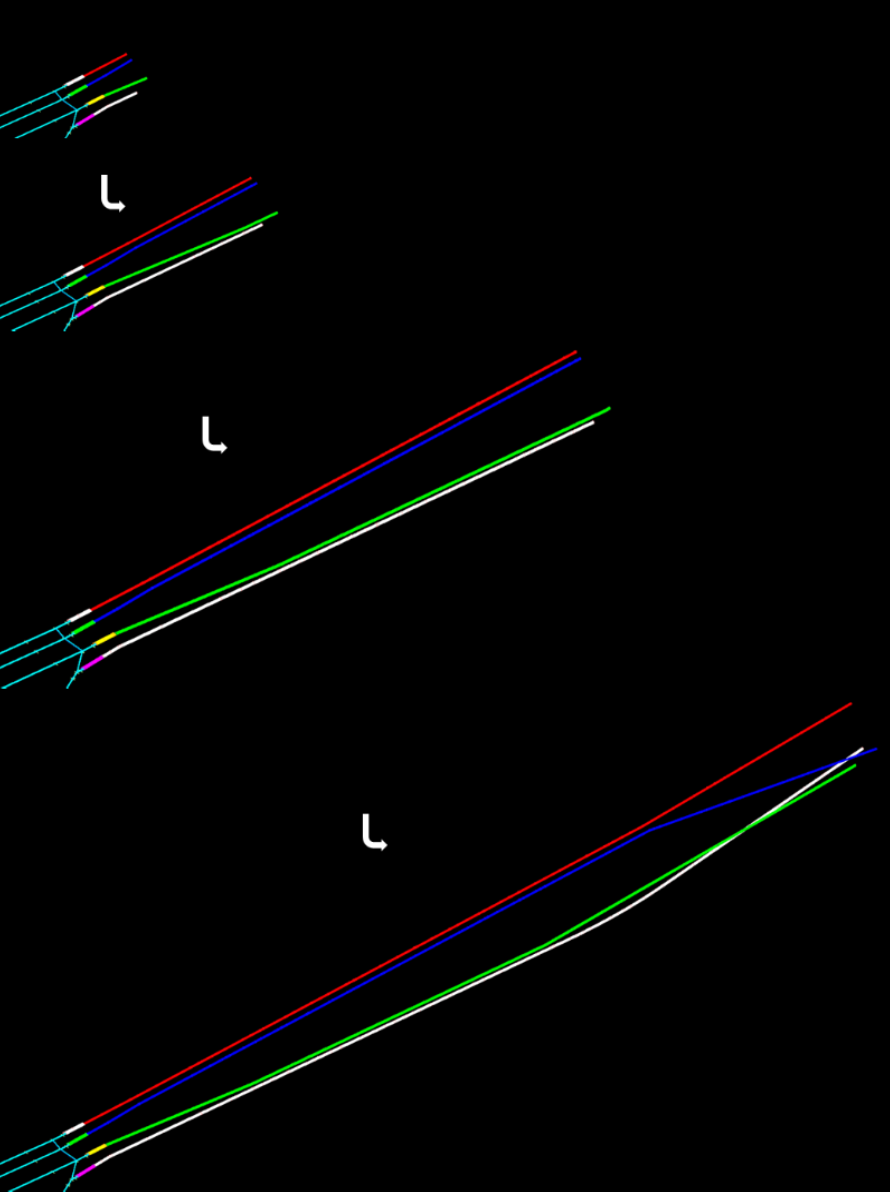
Figure 2 – Animation of simulated access tunnels
From Table 3 it is concluded that all Blast-at-Will (BAW) scenarios have a clear advantage over fixed blast scenarios. When BAW is linked with the automine shift schedule (allowing for 3 hours additional work time as opposed to the conventional shift schedule) and equipment parameters, it produces the best results within each scenario subgroup of four scenarios. Only three Drill and Blast scenarios can advance all four drives with an average advance higher than the minimum advance required for the study.
Scenario 4, which consist of 180 m muck bay spacing, automine shift schedule and equipment parameters, as well as a Blast-at-will setup., achieved the target first. Scenario 4 completed all four drives faster compared to the Base Case (scenario 1):
- Vent exhaust drive completed 17 months faster.
- Vent intake drive completed 16 months faster.
- Main drive completed 14 months faster.
- Conveyor drive completed 17 months faster.
Scenario 24 performed better than scenario 4, with the same 180 m muck bay spacing, automine shift schedule and Blast-at-will setup as scenario 4, but with two drills set to drill the drive faces 7 m and wider. Scenario 24 completed all four drives faster compared to the Base Case (scenario 1):
- Vent exhaust drive completed 19 months faster.
- Vent intake drive completed 19 months faster.
- Main drive completed 16 months faster.
- Conveyor drive completed 19 months faster.
The best result pertaining to the Drill and Blast scenarios is achieved by scenario 28. The parameters used for this scenario are 180m muck bay spacing, automine shift schedule, a Blast-at-will setup, two drills set to drill the drive faces 7m and wider, and two bolters set to support the drive faces 7m and wider. Scenario 28 completed all four drives faster compared to the Base Case (scenario 1):
- Vent exhaust drive completed 22 months faster.
- Vent intake drive completed 22 months faster.
- Main drive completed 19 months faster.
- Conveyor drive completed 21 months faster.
Table 3 Drill and blast completion comparison
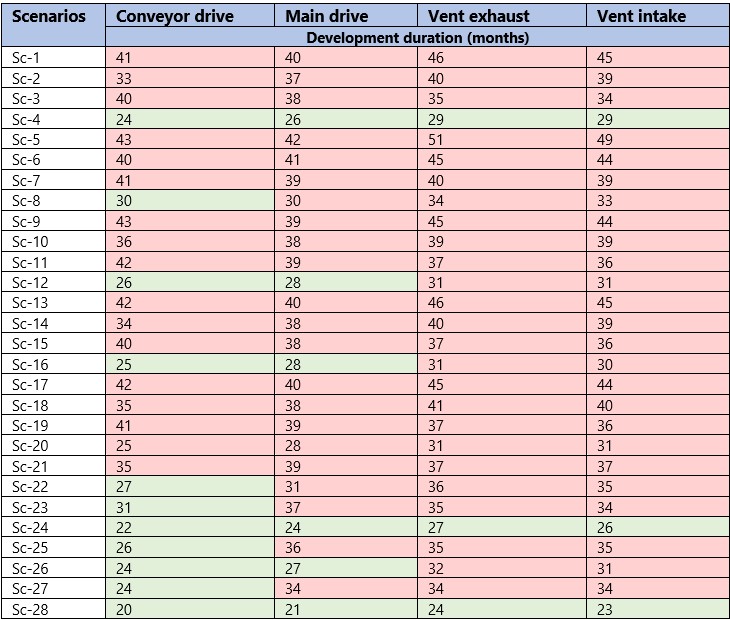
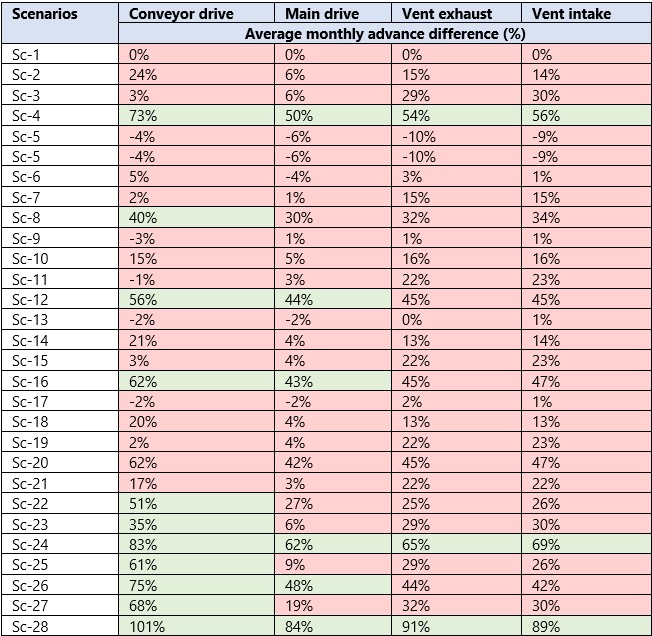
Table 4 depicts the average advance per month, shown as a percentage difference when compared to the Base Case (scenario 1). Scenario 4 achieves more monthly meters as follows:
- Vent exhaust drive 54% more.
- Vent intake drive 56% more.
- Main drive completed 50% more.
- Conveyor drive completed 73% more.
Scenario24 achieves more monthly meters as follows:
- Vent exhaust drive 65% more.
- Vent intake drive 69% more.
- Main drive completed 62% more.
- Conveyor drive completed 83% more.
Scenario 28 achieves more monthly meters as follows:
- Vent exhaust drive 91% more.
- Vent intake drive 89% more.
- Main drive completed 84% more.
- Conveyor drive completed 101% more.
Table 4 – Drill and blast average monthly advance difference
Vent exhaust drive completed 28 months faster.Table 5 displays the simulated duration of each tunnel drive for all the TBM scenarios evaluated (scenarios 29 to 38). The tables are colour coordinated to represent various levels of performance established in the study, with only green achieving the minimum study target requirement for the TBM. Table 6 presents the average advance per month as a percentage difference compared to the Base Case (scenario 1).
Scenarios 29 to 32 reflect the advance of only TBM’s cutting of all four the access drives, after the 120 m launch tunnel has been Drill and Blasted and 4 months have been allocated for TBM setup and commissioning. The assumption was made that the 12-month manufacturing time and 2-month shipping time of a TBM occurs before the tunnel start date to allow the TBMs to be available for setup once the 120m launch tunnel has been Drilled and Blasted. Three of the four scenarios finish the four tunnels with the minimum study requirements being met. This is achieved because the TBM’s in these scenarios are set to the daily 2 × 10h effective cutting shifts. Scenario 30, which is set to a daily 2 × 8.5h cutting shift, completes the four main tunnels two months later.
In scenarios 31 and 32 the launch tunnel’s Drill and Blast crews are set to Blast-at-will (BAW), with scenario 32 having a shared crew between the two sets of drives, which shows no difference in the completion time of the tunnels. This suggests that shared crews for the launch tunnels would save on the number of equipment required without any negative effect on the tunnel end date. Scenario 32 completed all four drives faster compared to the Base Case (scenario 1):
- Vent intake drive completed 27 months faster.
- Main drive completed 22 months faster.
- Conveyor drive completed 23 months faster.
In scenarios 33 to 36 the Vent Intake and Conveyor drives are cut with TBM’s, while the Vent Exhaust and Main Access drives are developed via Drill and Blast connecting into the TBM tunnel every 500 m. This allows multiple crews to work in advance within the same tunnel. Scenario 35 performed the best of the hybrid TBM & Drill and Blast scenarios, with the two TBM tunnels finishing in 18 months, and their Drill and Blast tunnels in 26 months with an average advance increase of 55% in the Main drive and 76% in the Vent drive. This improvement is achieved by utilising the Automine shift schedule and a Blast-at-will setup. Scenario 35 completed all four drives faster compared to the Base Case (scenario 1):
- Vent exhaust drive completed 20 months faster.
- Vent intake drive completed 28 months faster.
- Main drive completed 14 months faster.
- Conveyor drive completed 23 months faster.
Scenarios 37 and 38 reflect the advance of only TBM’s cutting for all four of the access drives. The assumption was made that the 12-month manufacturing time and 2-month shipping time of a TBM occurs only after the 120 m launch tunnels start with Drill and Blast development. After the 120 m launch tunnel has been Drill and Blasted and the TBMs have arrived on site, 4 months are allocated for TBM setup and commissioning before cutting commences. The manufacturing delay causes the finish time of scenario 37, for the four main tunnels, to end one year later than scenario 29. The manufacturing delay is also imposed in scenario 38, which results in the same, one year later, completion compared to scenario 30, where both scenarios are set to the daily 2 × 8.5 h cutting shifts.
Table 5 – TBM completion comparison
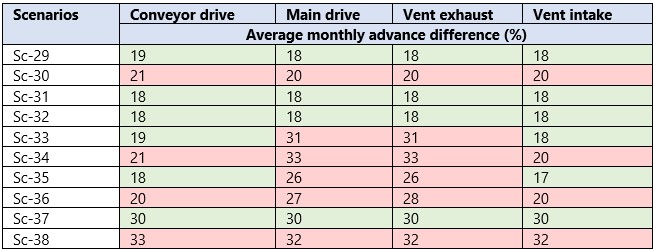
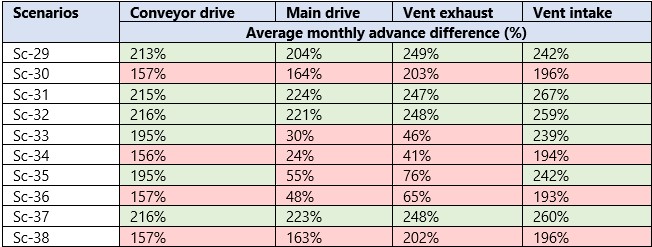
Table 6 reflects the average advance per month depicted as a percentage difference when compared to the Base Case (scenario 1). The table only reflects the average advance of the four tunnels once developed and does not include waiting times for setup and commissioning of TBMs. Scenario 32 achieves more monthly meters as follows:
- Vent exhaust drive 248% more.
- Vent intake drive 259% more.
- Main drive completed 221% more.
- Conveyor drive completed 216% more.
Scenario 35 achieves more monthly meters as follows:
- Vent exhaust drive 76% more.
- Vent intake drive 242% more.
- Main drive completed 55% more.
- Conveyor drive completed 195% more.
Scenario 37 achieves the same advance increase as scenario 32 but ends one-year later due to the TBM’s order date only occurring at the start of the 120 m launch tunnels.
Table 6 – TBM average monthly advance difference
The results are a clear indication of the value that can be unlocked when using the appropriate data and technology solutions. This case study is a prime example of the opportunity cost and risk of using a static mine design with deterministic calculations for mine development. By integrating the mine design to specialised simulation software and performing various scenario-based analysis, the mine design becomes dynamic as the simulation outputs provide the required operating parameters for a specific design. To be able to decrease your mine development approximately two years and advance at twice the rate is of significant value on multiple levels for any mining operation.
5. Conclusions
The results reflect how complex mining development cycles can be accurately modelled, by taking a large number of variables into consideration and by integrating the mine design into a simulation model. Data such as various rock and face attributes enabled accurate model configuration, decreased model setup time, as well as limit data transfer and setup related errors. The following conclusions were made in the study:
Drill and Blast
In the Drill and Blast scenarios evaluated, scenario 28 performed the best by utilising two drills to drill faces 7 m and wider and two bolters set to support faces 7 m and wider (effectively halving the drill and bolt time). This scenario achieves an average advance increase of 90% in the large 9 × 8 m Vent Tunnels but requires an additional drilling and bolting machine per tunnel to achieve it. Additionally, a Blast-at-will setup and the Automine machine shift schedule are required to complete the various drives between 20 and 24 months.
With the same shift and blast setup, but removing the second bolter at the face, and utilising two drills to drill faces 7 m and wider, scenario 24 is able to achieve average advance increase of 67% in the large 9 × 8 m Vent Tunnels, and complete the various drives by between 22 and 27 months.
Scenario 4 uses only one drill and bolter at the face, which achieves an average advance increase of 55% in the large 9x8m Vent Tunnels. With a Blast-at-will setup and the Automine machine shift schedule, it finished the various drives between 24 and 29 months.
TBM
The best mining and technology setup will be to have all four tunnels cut via TBM’s, utilising a daily 2 × 10h effective cutting shifts, which will result in the completion of all four tunnels within 18 months. Using daily 2 × 8.5 h effective cutting shifts will complete the same tunnels two months later. Both these scenarios have the assumption that the 12-month manufacturing time and 2-month shipping time of a TBM occurs before the tunnel start date to allow the TBMs to be available for setup once the 120 m launch tunnel has been Drill and Blasted. If the TBM manufacturing only starts at tunnel start-up, the project completion is delayed by one year, resulting in a tunnel complete date one month later than scenario 4, described in the above Drill and Blast section.
With the hybrid TBM and Drill and Blast scenarios, the two TBM tunnels (utilising a daily 2 × 10 h effective cutting shifts) finish within 18 months, and their Drill and Blast tunnels in 26 months. This improvement is achieved for the Drill and Blast crews utilising the Automine shift schedule and Blast-at-will setup. The assumption is that the 12-month manufacturing time and 2-month shipping time of a TBM occurs before the tunnel start date.
Due to the relatively small difference between the best performing TBM and Drill and Blast scenarios (6 months), a financial study will have the largest impact on the developing method of reaching the ore body. The study and the capability to integrate a mine design layout directly into simulation software enabled the client to evaluate conventional access options and various rapid development technologies to best access the orebody in the shortest timeframe and at the lowest possible cost. The approach followed provides the client with the opportunity of improving the NPV of the project by providing a plan for accessing the orebody earlier in the life of the operation and more specifically providing the appropriate equipment parameters for the design.
The approach followed and technology used enabled the client to make informed decisions on their mine design and mine development plan. The simulation model was used to establish a range of options with specific operating parameters and philosophies as well as quantify the benefit and performance of each scenario. The insights gained from such a study has a significant financial impact for the mine development and was achieved in a relatively short timeframe.